The College Board’s SAT is a standardized assessment meant to fairly measure students’ abilities regardless of their socioeconomic background. While the test is often marketed as a ‘common yardstick,’ data has proven this label to be far from true—a reality I aimed to highlight by creating these foldable yardsticks.
Common Yardstick
Fall 2019
Fall 2019


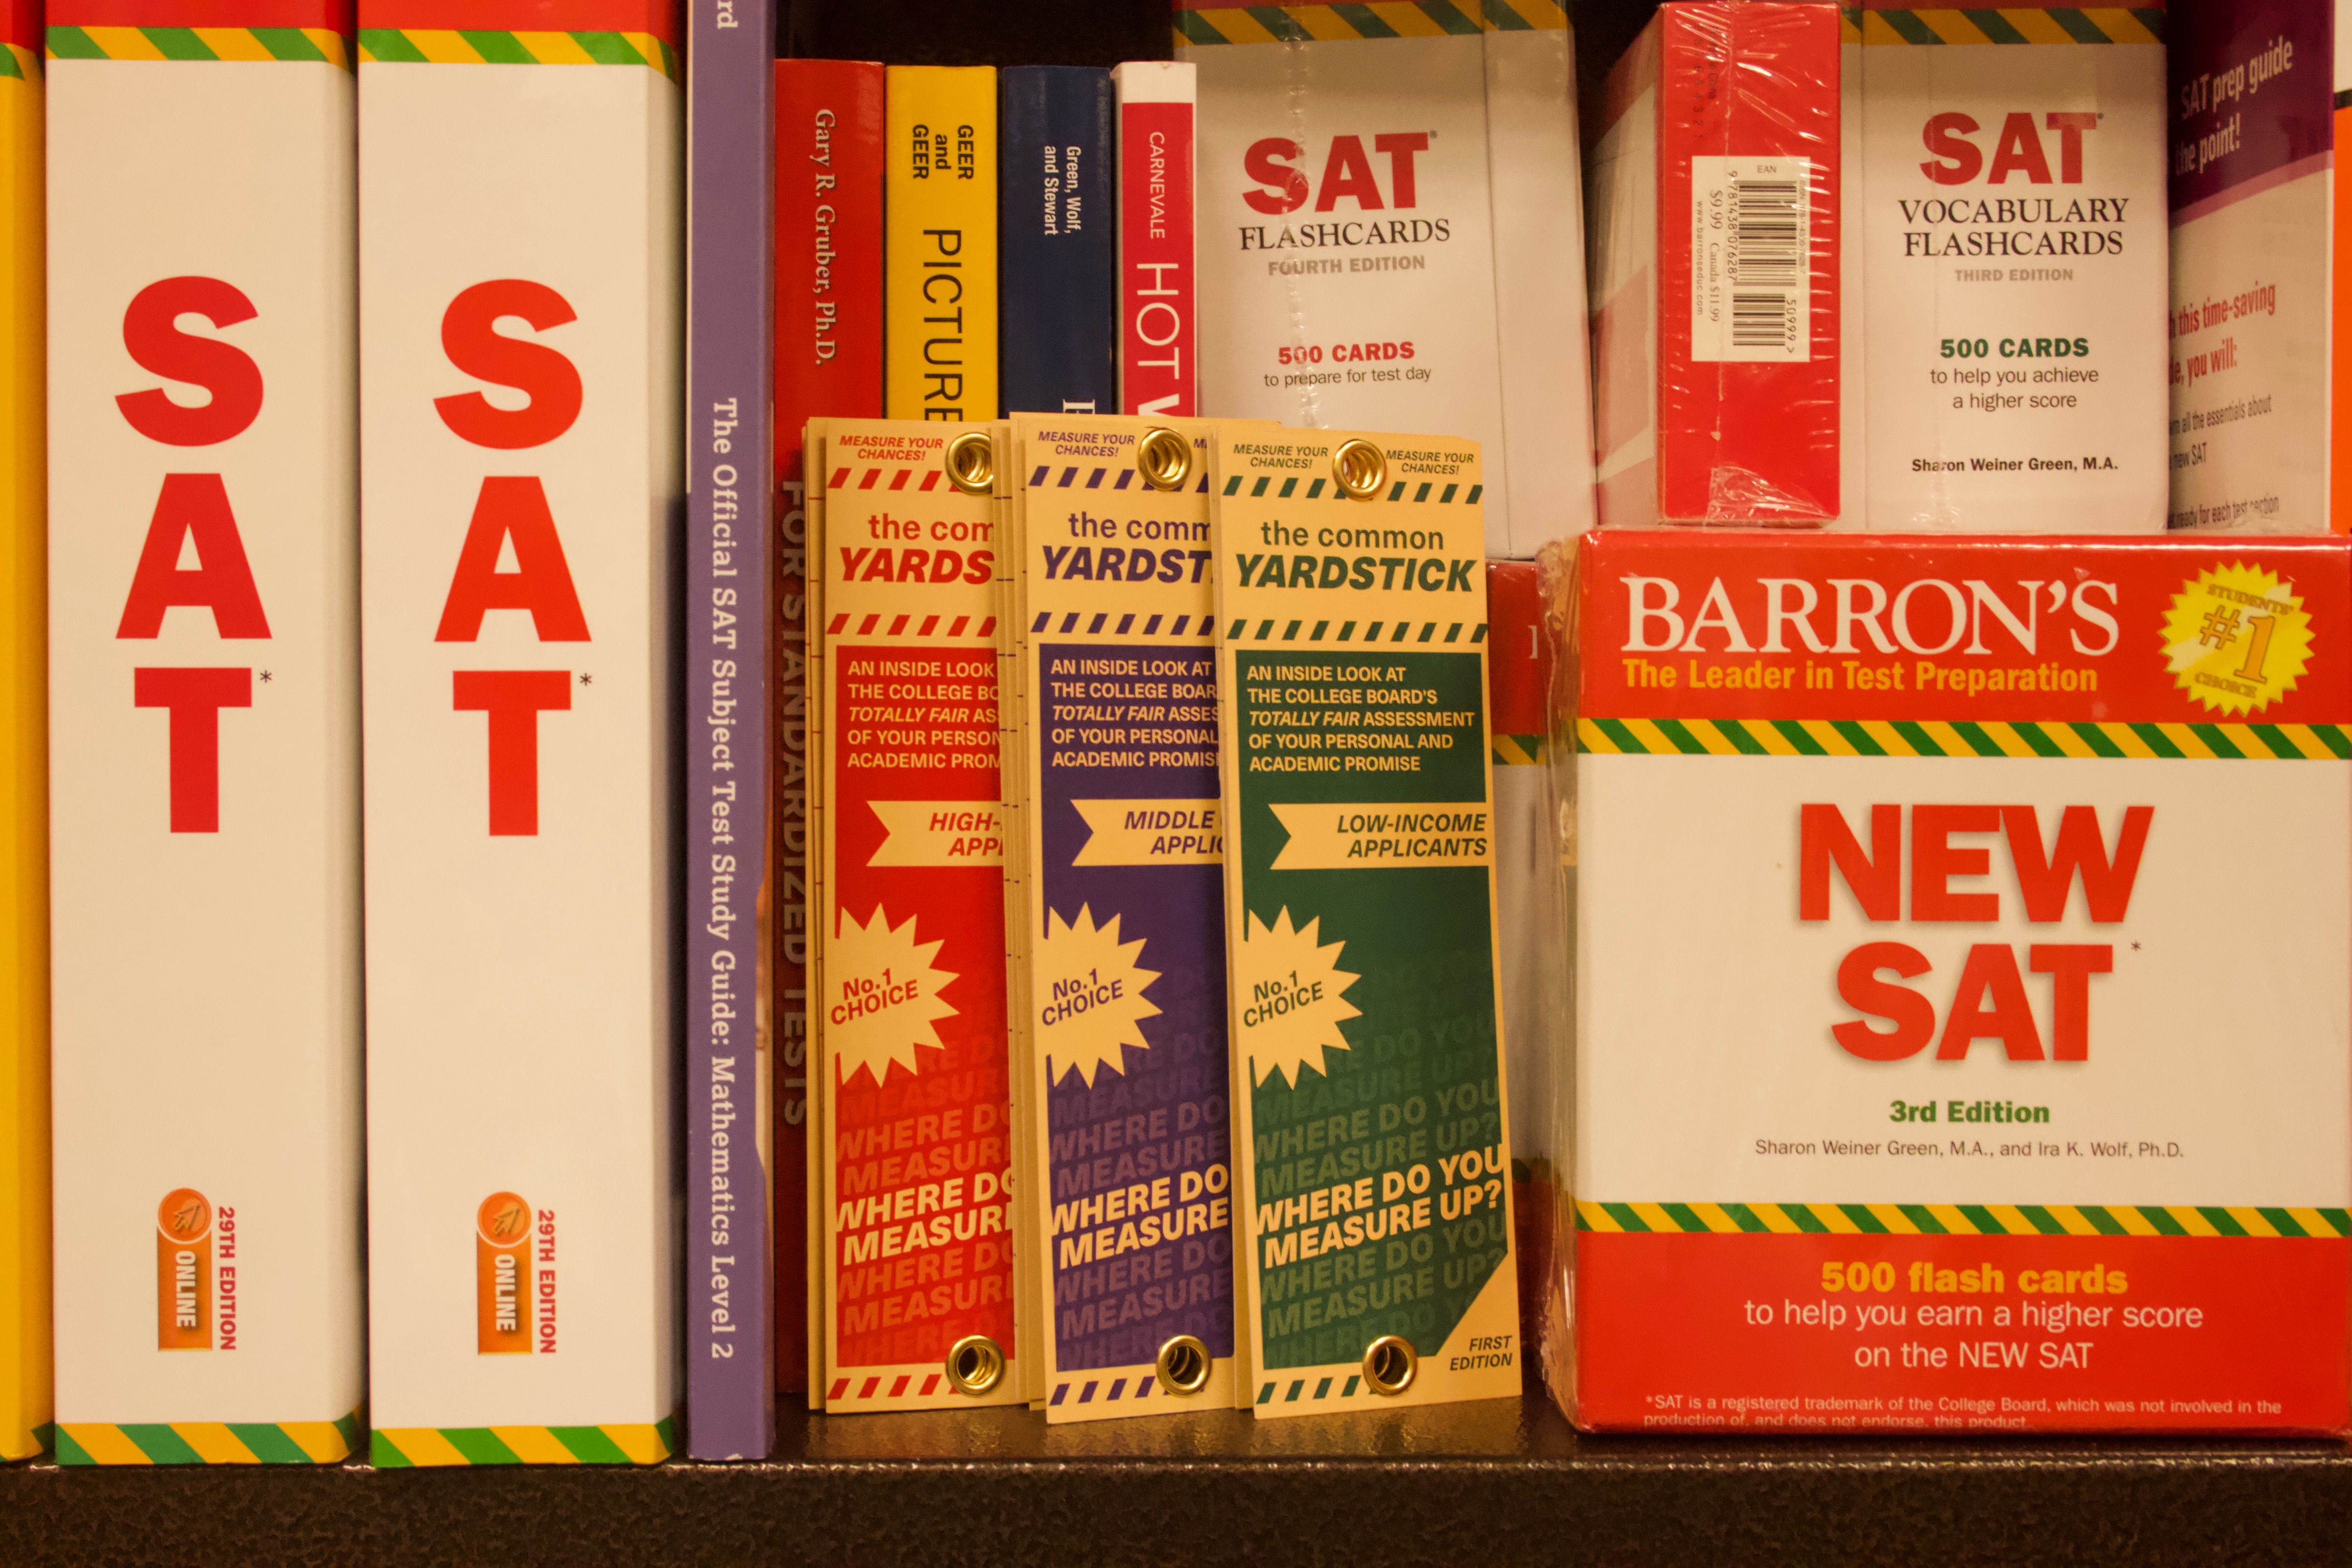
I pulled some visual language from well known test prep publications as I wanted to parody their loudness and ensure that my designs would blend into the SAT vernacular. I also wanted to draw attention to just how bombastic some of the messaging can be.
Once unfolded, however, the yardstick leaves the satirical tone behind and reveals information as to why wealthier students get higher SAT scores on average. While the front sides of the yardsticks include the same copy, the backs, when fully outstretched, feature a data visualization of the average scores students in each family income bracket receive. When the yardsticks rest next to each other, these visualizations can function as one unified bar graph.
Once unfolded, however, the yardstick leaves the satirical tone behind and reveals information as to why wealthier students get higher SAT scores on average. While the front sides of the yardsticks include the same copy, the backs, when fully outstretched, feature a data visualization of the average scores students in each family income bracket receive. When the yardsticks rest next to each other, these visualizations can function as one unified bar graph.
